
AI and Intelligence
Healthcare Data and Analytics
Trustworthy insight from healthcare data: clear definitions, connected sources and analytics that teams can act on.
Overview
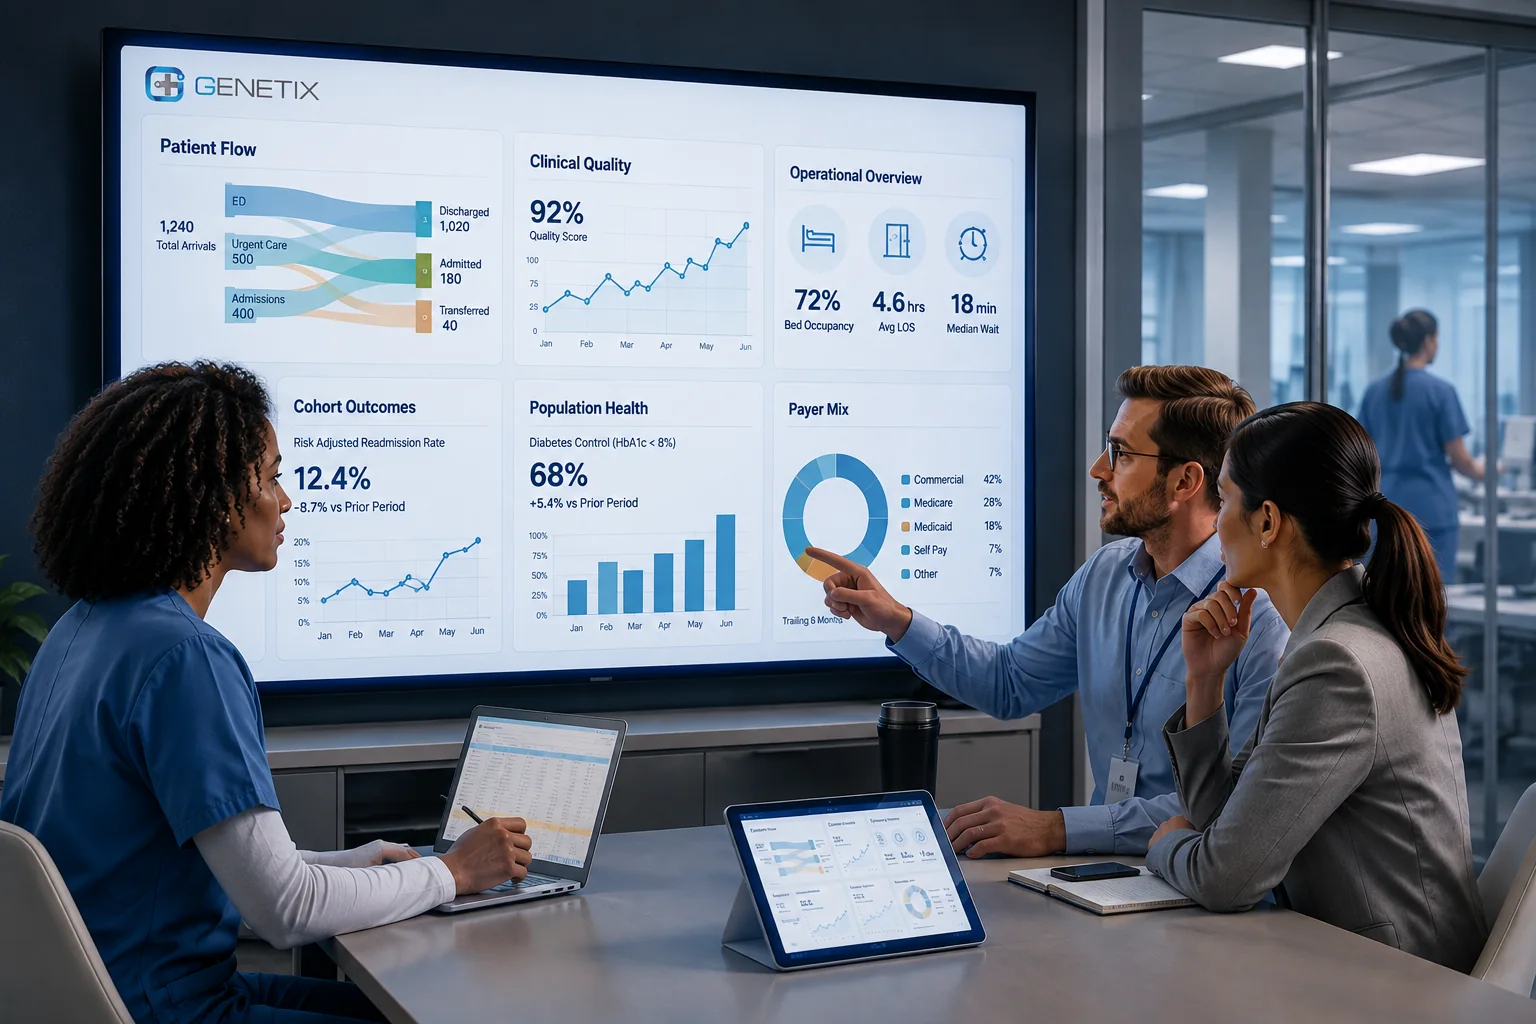
Genetix healthcare data and analytics brings clinical, operational and administrative data together on shared definitions. Dashboards and reports serve different audiences — from ward coordination to board reporting — while drawing on the same governed foundation, so a figure means the same thing wherever it appears.
Analytics also feeds back into operations: workflow performance, capacity patterns and robotic-fleet activity become visible, giving teams the information to improve the processes they run.
Healthcare context
Organisations collect more data than ever, yet meetings still argue about whose figures are right. Useful analytics starts with agreed definitions and connected sources — then insight can inform planning, quality work and daily operations.
Intended users
- Management and department leads
- Quality and process teams
- Data and BI teams
- Operational coordinators
Availability and deployment options are confirmed as part of an initial consultation with our team.
Capabilities
What it provides
Governed data foundation
Connected sources with agreed definitions, lineage and access rules.
Role-appropriate dashboards
Operational, clinical-quality and management views built for their audiences.
Process and workflow analytics
Insight into pathway performance, task flow and bottlenecks.
Operational intelligence
Near-real-time views for capacity, logistics and robotic-fleet activity.
Structured export
Governed data delivery to research, regional and reporting contexts as configured.
Example workflow
How it works in practice
- 1
Sources connect once
EHR, management, ERP and workflow data land in the analytics foundation under agreed definitions.
- 2
Teams see their view
A ward sees today's flow; quality sees pathway indicators; management sees the aggregate.
- 3
A pattern raises a question
Analysts drill from indicator to underlying process data to understand the cause.
- 4
The process improves measurably
Changes made in workflows show up in the same indicators — closing the loop.
Example workflow for illustration. Actual configurations are defined with each organisation and always keep qualified professionals in control of clinical decisions.
Integration
Part of a connected environment
Analytics consumes governed data from across the ecosystem through the integration platform and can publish indicators back into operational views.
Analytics is the reflective layer of the ecosystem: it shows how information, workflows and robotic systems actually behave, and supplies the evidence for optimisation.
Connects with
- EHR, hospital management and ERP data
- Workflow and robotics activity data
- External reporting contexts (as configured)
Implementation
Introduced with care
Programmes start with definitions and priority questions, then connect sources incrementally. Data-quality findings are treated as improvement work, not blockers to hide.
Responsible use
- Access to analytics follows role and purpose.
- Definitions and lineage are documented, so figures can be explained.
- Secondary use of data follows configured governance and applicable regulation.
Related
Explore further
Get in touch
Talk to our team about Data and Analytics.
We can walk through the capability in the context of your organisation, your systems and your priorities.